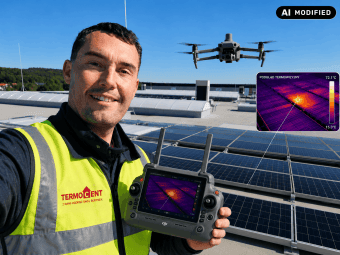
A drone used for technical diagnostics is more than a “flying camera”. It is a mobile measurement platform that can collect visual, thermal and spatial information from large or difficult-to-access assets in a short time.
Depending on the task, we use visible-light imagery, thermal imaging, precise RTK positioning, distance measurements and photogrammetric techniques. This combination can support the detection of thermal anomalies, visual inspections, progress documentation, localisation of observed components, geometric measurements and the creation of spatial models of the asset.
The drone itself is not the most important element. The value comes from combining an appropriate data-acquisition method with careful processing and specialist interpretation.

What changes when a drone is used?
A conventional ground-based inspection is highly effective when the operator has direct access to the component. The task becomes more difficult as the height and area increase, access becomes restricted, or the number of components requiring inspection grows.
An aerial platform changes the scale and method of data acquisition. The operator can quickly adjust the position, altitude and viewing angle, record larger areas and return to identified locations. In many assignments, this reduces the need for access platforms, scaffolding and work at height.
A drone does not replace close-range testing. It can, however, scan an extensive area efficiently, identify locations that need attention and provide material for further diagnostics, documentation or measurements.
The example below combines thermal imagery, visible-light imagery and a spatial model of a photovoltaic installation.

Example combining thermal imagery, visible-light imagery and a spatial model of a photovoltaic installation.
One platform, several types of data
TERMOCENT uses a DJI Matrice 4T, among other equipment. From a measurement perspective, its value lies in the combination of several technologies: visible-light cameras with different fields of view, a radiometric thermal camera, precise RTK positioning, a laser rangefinder, environmental sensing systems and software for 2D and 3D photogrammetric reconstruction.
| Component | Key specifications |
|---|---|
| Wide-angle camera | 48 MP, 24 mm equivalent focal length, 82° FOV, f/1.7 |
| Medium tele camera | 48 MP, 70 mm equivalent focal length, 35° FOV, f/2.8 |
| Telephoto camera | 48 MP, 168 mm equivalent focal length, 15° FOV, f/2.8 |
| Thermal camera | 640 × 512 px, 30 Hz, 8–14 µm spectral range, 45° DFOV, 16-bit radiometric R-JPEG; 1280 × 1024 Super Resolution mode |
| RTK positioning | RTK fixed solution accuracy: 1 cm + 1 ppm horizontally and 1.5 cm + 1 ppm vertically |
| Laser rangefinder | Measurement range up to 1,800 m under the conditions specified by the manufacturer |
Visual inspections and construction-progress documentation
Not every inspection requires thermal imaging. Visible-light cameras can be used to inspect difficult-to-access components, document their condition, examine details from a safe distance and create comparative material at successive dates.
Applications include documenting construction progress, checking selected works, supporting handovers, recording roofs and façades, assessing structural condition, observing corrosion or mechanical damage, and documenting changes to an asset over time.
When flights are repeated in a consistent manner, material from different dates can be compared. This provides more than a single overhead photograph: it creates an organised record of the development of a project or changes in technical condition.
Photogrammetry, RTK and geometry: from photographs to spatial data
Photogrammetry plays a central role in survey and inventory tasks. It reconstructs the shape and position of objects from a suitably captured series of photographs. RTK positioning improves the positional information associated with the imagery, while subsequent processing produces a spatial model.
The photographs then become more than visual documentation. They form an environment in which the position of components can be analysed, distances and height differences measured, slopes determined and selected points revisited after the flight.
This area brings together techniques used in surveying and technical diagnostics: photogrammetry, precise GNSS/RTK positioning, 3D reconstruction, geometric measurement and, where needed, thermal imaging.
From a flight of under four minutes to a 3D model
During one example photogrammetric flight, capturing imagery of a building, its surroundings and a carport took less than four minutes. After the flight, the photographs were processed in DJI Terra.
The same dataset can be presented in several forms. Each highlights a different aspect of the model and supports a different type of task.

3D Mesh — a geometric surface mesh covered with visual information. It enables spatial viewing of the asset and analysis of the relative position of its components.

Gaussian Splatting — a photorealistic representation of the same area, particularly clear where geometry and vegetation are complex.

Point Cloud — a photogrammetric point cloud of the same area, useful for geometric analysis and spatial inventories.
A 3D model as measurement and documentation material
A spatial model allows the inspection area to be revisited after the flight. It can document the existing condition, support the planning of further examinations, enable measurements of difficult-to-access components and provide a basis for comparing successive states of the asset.
- inventories of assets, installations and site features,
- checking and documenting construction progress,
- measurements of distances, height differences and slopes,
- localisation of observed defects and areas of interest,
- spatial documentation for subsequent analysis,
- comparison of changes to an asset over time.
Thermal imaging as one layer of information
Thermal imaging is an important part of our capabilities. It becomes especially useful where temperature or the distribution of infrared radiation can indicate a component behaving differently from its surroundings.
Radiometric thermograms can be analysed after capture, with measurement points and areas selected and temperature values compared. The result is therefore more than a colourful image: it is measurement material that requires correct configuration and interpretation.
Photovoltaics: combining visible-light and thermal imagery
Photovoltaic installations show clearly why different observation methods should be combined. Many irregularities are invisible or difficult to identify in visible-light imagery. In the infrared image, the difference may become clear.

Visible-light image on the left: can you identify the fault? Thermal image of the same area on the right.
Comparing the two images makes it possible to identify an unusual thermal pattern and then relate it to a specific component in the visible image. This is particularly important on large arrays where dozens or hundreds of modules look very similar from above.

Project example: a local thermal anomaly in a PV module
During one photovoltaic inspection, a module displayed a thermal pattern that differed clearly from adjacent components. Reference points on normally operating sections of the installation were approximately 38–40°C, while the maximum recorded in the anomalous area was 60.7°C.
Within area SQ2, limited to the affected module, the mean temperature was approximately 41.1°C. The difference of more than 20°C relative to neighbouring sections was the basis for referring the module for detailed assessment.
The inspection report identified damage associated with cracks in the module as the probable cause of the elevated temperature and recommended replacement as the corrective action. This was a conclusion for this particular case. Elevated temperature alone does not automatically confirm a specific type of damage.

Figure 6. Thermogram of the inspected section of the installation. Area SQ2 covers the module with a clearly elevated temperature.
From detecting a fault to locating it precisely
On a large installation, stating that “there is an anomaly somewhere on the carport” has limited practical value. The service technician also needs to know exactly where the component is and how to return to it.
A spatial model can relate the fault position to recognisable edges and structural components. For a selected line, four geometric values can be obtained: straight-line distance, horizontal distance, vertical difference and slope angle.
- Straight Distance — the actual length of the line in three-dimensional space,
- Horizontal Distance — the distance in horizontal projection,
- Vertical Distance — the height difference between the points,
- Slope — the angle of the selected line.
In this inspection, thermal data were combined with spatial documentation and visible-light imagery. This made it possible to indicate the position of the affected modules within the entire structure and locate them in relation to recognisable points on the asset.

In the example, the location report includes spatial distances to the point of interest. The maintenance team therefore does not have to search the entire installation again; it receives information that supports direct access to the identified module.

Fault location using geometric measurements: straight, horizontal and vertical distances and slope angle.
Alongside the measurements, the report describes the location, assesses the probable cause and recommends the next step. The flight documentation is therefore useful not only to the thermographer but also to maintenance teams, installation managers and service contractors.
Where else can this approach be used?
Visible imagery, thermal imaging and spatial data can be combined in many different assignments. The list is not closed, because the client’s specific technical problem determines which methods are most useful.
- roofs of industrial, warehouse and commercial buildings,
- façades of tall or difficult-to-access buildings,
- photovoltaic installations and energy infrastructure,
- pipelines, tanks, process installations and elevated equipment,
- steel structures and components requiring visual inspection,
- spatial inventories of assets and installations,
- construction-progress documentation,
- localisation and measurement of areas of interest,
- periodic condition records and comparison of changes over time.
Roofs and façades
A drone can observe roofs and façades from a perspective that is difficult or impossible to achieve from ground level. Depending on the purpose, we can collect visual, thermal or photogrammetric documentation and identify areas that require further examination.
For thermal diagnostics of buildings, however, external façade observation is only one part of a complete inspection.
Comprehensive diagnostics may also require an internal inspection under appropriate temperature conditions. The necessary scope depends on the construction, the observed issue and the purpose of the assessment.
Industrial and difficult-to-access assets
Temperature can be a valuable diagnostic parameter in industrial facilities, but conventional visual observation and asset geometry can be just as important. The same platform can therefore support the detection of unusual temperature distributions, documentation of corrosion and damage, structural-condition checks, inspection of inaccessible components and inventories of their location and dimensions.
In practice, the most interesting assignments often begin with a technical problem that a client brings to us for the first time. We select the method to match the question, not the other way around.
Why can not every inspection be carried out immediately?
The effectiveness of an inspection depends on its purpose and the conditions. Thermal imaging is affected by factors including solar exposure, wind, ambient temperature, installation load, surface properties and viewing geometry. Photogrammetry depends on flight planning, image overlap, visibility of the component and positioning quality.
Safe flight conditions, airspace restrictions and the characteristics of the asset must also be considered. We therefore begin by defining what needs to be detected, measured or documented and only then select the data-acquisition method.
The camera records radiation; a specialist interprets the result
A thermal camera does not “see temperature” directly. Its detector records infrared radiation reaching the camera — in the system used here, within the 8–14 µm range. The temperature value is then calculated from the recorded signal and the measurement parameters entered.
A colourful thermogram is not a diagnosis in itself. Its result and interpretation are affected by surface emissivity, reflected radiation, atmospheric conditions, distance, viewing geometry and the operating state of the component.
The specialist’s task is to separate the observation from the technical conclusion. A report should make clear what was recorded, which values were measured, which interpretation is considered probable and whether confirmation by another method is recommended.
Combining drone inspection with conventional measurements
The greatest value comes from combining methods rather than relying on a single tool. A drone can scan a large area, detect or locate a point of interest and, where the asset permits, be followed by close-range diagnostics or measurement with another instrument.
- STAGE 1 — aerial inspection: collection of visible imagery, thermal data or photogrammetric material,
- STAGE 2 — localisation: assignment of the observation to a specific component and determination of its position,
- STAGE 3 — local measurement or verification: close-range examination, an additional measurement or a service inspection,
- STAGE 4 — analysis and report: integration of observations, measurements, geometry and conclusions.
What should the report provide?
The report should organise the data so that the person responsible for the asset can make an informed technical decision.
Depending on the inspection scope, the documentation may include visible-light photographs, radiometric thermograms, temperature values, models and geometric measurements, the locations of identified areas, descriptions of observations, probable causes and recommendations for further verification or repair.
In the example presented here, the report identifies a specific PV component, shows temperature values, explains the probable cause and recommends an action. This turns the flight data into a basis for subsequent maintenance, investment or service decisions.

Figure 8. Example report extract: thermogram, characteristic values, location, probable-cause description and recommendation.
Key benefits of technical drone inspections
- efficient data collection across large and difficult-to-access areas,
- reduced need for work at height,
- integration of visual inspection, thermal imaging and spatial data,
- creation of 3D models, point clouds and photogrammetric documentation,
- localisation of observed anomalies and defects,
- geometric measurements of distances, height differences and slopes,
- documentation of construction progress and existing condition,
- repeatable inspections and comparison of changes over time,
- radiometric thermograms available for later analysis,
- identification of areas for further diagnostics without searching the entire asset.
The drone is a tool. The data and how they are used matter most.
Combining visible-light imagery, thermal imaging, precise positioning and photogrammetry allows an asset to be examined from several perspectives at once. An anomaly can be detected, its visible appearance reviewed, its position determined, the surrounding geometry measured and a digital record retained for future comparison.
The value of the inspection does not come from the name of the aircraft used for the flight. It comes from sound planning, high-quality data acquisition, appropriate processing and the experience required to turn the results into useful technical information.
This is the direction in which TERMOCENT is developing its diagnostic services: from a single photograph or thermogram to integrated information about the condition, position and geometry of the inspected asset.
Do you have an asset that is difficult to inspect from ground level?
Tell us about the technical problem. We will propose an inspection scope and data-acquisition method suited to the asset and the purpose of the survey.
TERMOCENT
tel. +48 530 105 398
email: biuro@termocent.pl